3.2 Admiralty Charts
Introduction
This section gives an introduction to modern Admiralty charts. It tells you the main features and most important/relevant information you are likely to need when learning to be the skipper of a cruising yacht. (Older charts used a different set of colours and symbols and are not dealt with here.)
It is NOT a definitive guide to all the symbols and information you will find on Admiralty charts. We strongly recommend that you buy the Admiralty booklet that contains that information, as discussed at the end of this section.
Notes and General Information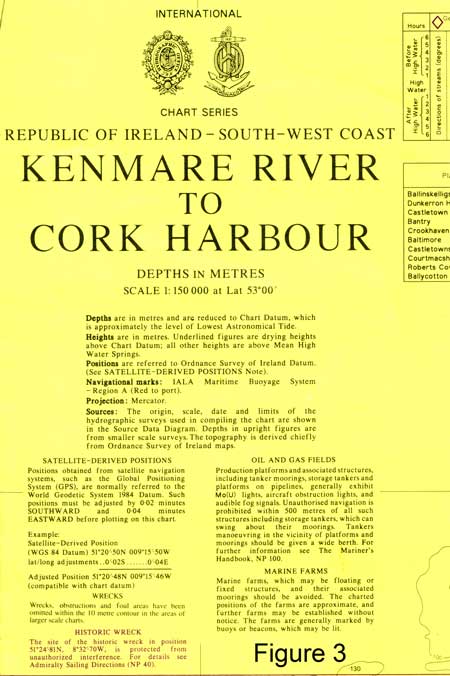
Admiralty charts will have a place where they print the title and general information about the chart: scale, unit of measurement of depths (usually metres, but fathoms for older charts), heights and the datums for depth, height and position. It will state the projection (usually mercator or transverse mercator) and the sources of survey information used in the chart, often with a diagram. See Figure 3.
This is followed by notes: it usually includes a paragraph on "satelite-derived positions" and how much they differ from the charted latitude and longitude, but as explained in section 2 the easier approach is to set your GPS to the same datum as the chart.
Other notes will deal with particular navigation hazards in the area, such as local magnetic anomalies (places where you can expect compass errors) fish farms or strong tidal streams.
It's good practice to glance at all this information when you first open up the chart and start planning your passage or pilotage. Personally, I don't find a scale like 1:150 000 particularly easy to visualise, but before using the chart, look at the side (where you measure distance - see Chapter 1) and see how big a mile is on the chart. This is very important when switching between two charts of different scales.
Coastlines and Depths
This is pretty much the most useful information the chart gives you. Depth of water is one of the most crucial things for the safety of vessels.
(It is assumed that you have read Chapter 2 on Tides: we don't re-explain the tidal terms like MHWS and LAT in this chapter. Read it through again if you are not sure.)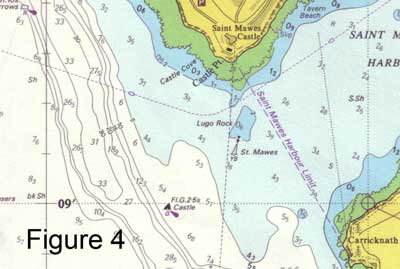
Admiralty charts use colour to give you a quick appreciation of the areas of different depths. Yellow is land, above High Water level, and the black line at the edge of the Yellow is the line of Mean High Water Springs MHWS. Green is the area which "dries", i.e. it sometimes covered by water and sometimes not. The edge of the green is the 0 metres contour, i.e. the line of Lowest Astronomical Tide LAT. It is shown as an uneven line if the coast is rocky.
The shallowest water is dark blue, then light blue for slightly deeper, and finally white. There are black line depth contours between the colours, and within the white area. Each contour states its "value" somewhere along the line, but in any case you can quickly see what they are by looking at the charted depth numbers. Figure 4 shows examples of this.
The contours that are shown are not the same on all charts: large scale pilotage charts might show contours at 0m, 2m, 5m, 10m, 15m, 20m, 30m because you are generally interested in using them to get close to the shore. Small scale passage-making charts will have fewer contours, say 10m, 20m, 30m and 50m. Similarly the blue colours are used in the most appropriate way for the scale of chart, for example:
• large scale: dark blue between 0m and 2m, light blue between 2m and 5m, white for greater than 5m (see figures 4 and 5).
• small scale: dark blue from 0m to 10m, light blue between 10m and 20m and white deeper than that.
The numbers are depths in metres - sometimes with a smaller subscript number (instead of using a decimal point) denoting tenths of meters.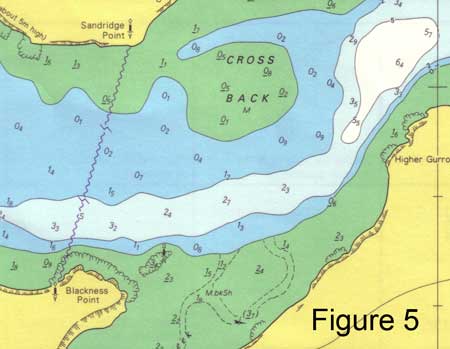
The numbers on the green drying areas are all "negative depths" or drying heights, also in metres, and this is denoted by underlining them. See Figure 5. (These will, of course, be under water when the tide comes in - this is all explained in Chapter 2.)
One final point about depths. The sea bed is naturally uneven, sometimes very uneven with rocky (or corally) gullies and pinacles. You can't chart every detail, so in practice you state the LEAST depth at a particular location. This is because charts are drawn mainly for the benefit and safety of surface craft, and what you need to know is the depth of the shallowest bit that you might hit.
Divers should note this. The average depth, or depth in the gullies, will be greater than the depth charted. The same rule applies to wrecks, where the shallowest depth is charted (they are sometimes swept by a wire to make sure that all the wreckage is below a certain depth).
Landmarks
Charts show features on the land that you might see from the sea, or that might be particularly useful in navigation.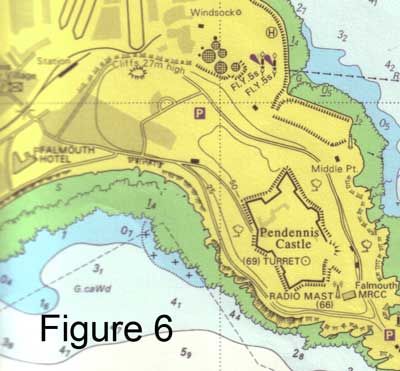
Lighthouses and other navigational aids are dealt with in a later section, but in addition to them the chart shows some roads and buildings: hills and height contours: rivers: and in particular, conspicuous landmarks used for navigation. These can be virtually anything: houses, forts, masts, chimneys, even a tree!
They are mainly pretty self explanatory, and you can look up any that aren't.
Dangers and Underwater Features
There are certain symbols that are used on charts that it is worth learning straight away. These are things that could endanger your vessel. They are listed in a specific Dangers section in the reference book.
Chief among these are rocks which are "considered a hazard to surface navigation". They are shown in a variety of ways depending on how accurately their position is represented and how deep they are, or whether they uncover at low water, and most yachtsmen learn to recognise the charted symbols as dangers rather than learning the precise definition of different ones. 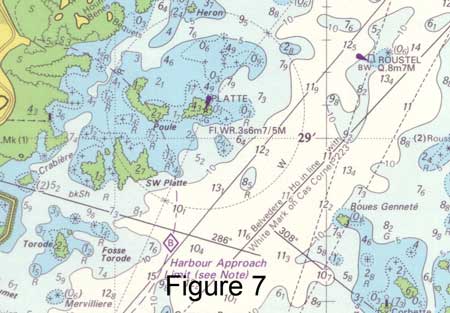
This is a pretty acceptable approach - keep away from all stars or crosses in shallow water, particularly with dark blue around them, with or without surrounding dotted lines! Figure 7 shows a rocky approach to Guernsey - keep away from the dark blue bits, and preferably in the white (>10m) unless you know exactly what you're doing!
There are also many symbols and letters which are used to tell you what is on the sea bed. These include descriptions of the bottom which can be quite useful when deciding where to anchor. But generally, there is more on the chart than the yacht skipper really needs to know (always remember, lots of different people use these charts: large ship skippers and pilots, fishermen, marine surveyors and engineers, etc etc).
Tidal Features and Information
Information on tidal streams is particularly relevant to small craft. This starts with the Notes (see above) which will warn you if there are particular tidal dangers in the area. Generally speaking, "dangers" in this context means:
• streams so strong that they can seriously affect small craft navigation
• streams that, because of their strength, and possibly the effect of uneven underwater terrain, can make the surface conditions dangerous, particularly in strong winds.
There are plenty of examples of both of these around UK coasts!
Many Admiralty charts carry quantitative information about tidal streams at particular positions. The position is denoted with a magenta diamond shape containing a letter (referred to as a "tidal diamond"), and data on the speed and direction of the todal streams at that position is given in a table. Chapter 2 section 4 contains a full explanation of this, so I won't repeat it here.
Additionally, some charts show "snapshots" of the tidal streams for the area for each hour before and after High Water, just like a miniature tidal atlas for the charted area. These generally work just like Tidal Stream Atlases, which are also explained in Chapter 2 section 4.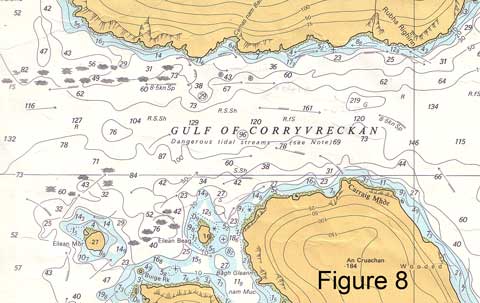
Certain symbols are used on the chart to show where overfalls (or whirlpools!) occur when a tidal stream is running. Overfall means rough conditions caused by a tidal stream and exacerbated by strong winds. Also, arrows are sometimes used to tell you the direction and speed of the greatest tidal streams at flood or ebb. Figure 8 shows the infamous Gulf of Corryvreckan, which has the lot (tidal rates at Springs of 8.5kts).
With this information it is rather up to you to decide how bad the dangers are likely to be, depending on the weather, whether the tides are Spring or Neap, and the time in the tidal cycle. You can usually find fuller information and guidance for yachtsmen in cruising guides and pilot books (remember, charts are used by very large ships where the dangers are a little different). If in doubt, go there when the tide is slack - and be aware of the difficulty of predicting the times of slack water in such a location. (For example in the Gulf of Corryvreckan, I have observed a discrepancy of more than an hour between the almanac prediction of slack water and the actual time of the event.)
Navigational Aids
Navigational aids are generally charted, and as a skipper you need to know:
• what the navigational aid is, and what it is trying to tell you
• how it is charted
• how its characteristics (lights and sounds) are represented, and what the representation means.
This is covered fully in the next section. At this point, we will just mention that Admiralty charts put a helpful magenta flash on anything that is lit at night, and that lighthouses and buoys are represented by distinctive symbols at their charted positions.
Chart 5011: Symbols and Abbreviations 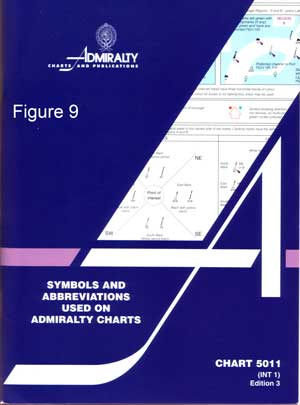
Every skipper should possess a copy of the Admiralty Publication Chart 5011 "Symbols and abbreviations used on Admiralty charts" (see Thematic Charts in the Catalogue). See Figure 9.
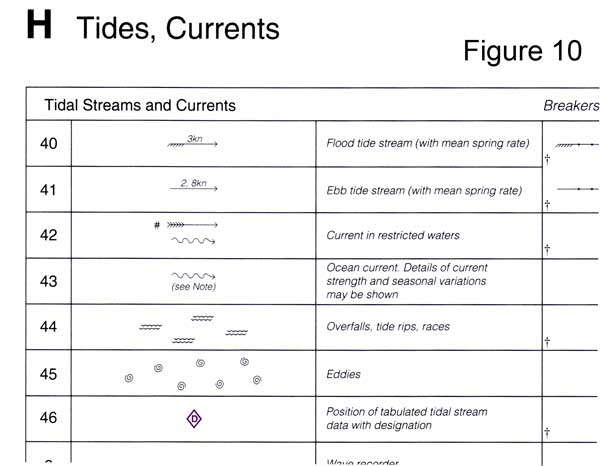
This is a completely comprehensive and authoritative definition of all symbols and abbreviations, as published by the same organisation that publishes the charts, and it only costs £9, so there is absolutely no point in using anything else. Figure 10 shows an extract.
(Almanacs tend to include a few symbols, but normally a very small number of what they consider to be the most relevant ones, and in the copy I'm looking at no information at all about light characteristics.)