3.1 About Charts
Charts are quite simply maps of the coast and sea. They come in various forms, and are published by national agencies and independent companies all over the world. Coverage of the world's seas and oceans is practically total, but the amount and accuracy of the information provided on them varies considerably.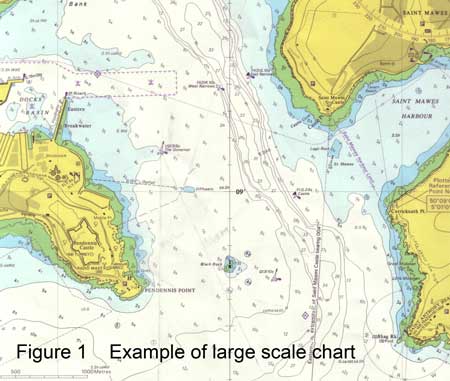
The primary use of charts is to enable surface craft to find their way safely from starting point to destination. So they include information on depth of water, dangers of various sorts, landmarks visible from the sea and navigational aids placed to help vessels to find their way around safely. They also include some information on human activity and "rules" about what you can do where; examples are port boundaries and areas where fishing or anchoring are not allowed. They relate all this to position, by giving you latitude and longitude scales on the chart, and direction by (usually) printing north up.
Charts are used by yacht skippers for navigation and pilotage, and because of the wealth of information they contain they are also useful for other seafarers such as underwater hunters and sightseers (fishermen and divers).
Navigation and Pilotage
The two words navigation and pilotage are closely related, but in yachting terminology they mean slightly different things - and involve slightly different techniques, which you will learn on a practical course.
Navigation is the set of techniques you use when you are out at sea, avoiding any dangers by a wide margin, and usually plotting your position every half hour or so because you are not particularly concerned to know exactly where you are, beyond knowing when you are going to reach your next waypoint or destination.
Pilotage is what you do when you are finding your way into or out of a port or anchorage: you use the chart, but you are close to shore and shallow water, and can probably see landmarks or navigational aids quite close to you. You need to know your position quite precisely, and you might have to keep out of the way of less manoeuvrable craft coming in or out.
(To use the analogy of driving, navigation could be like driving down the M6 for a few hours, occasionally checking distances to Birmingham/London, or junction numbers, whereas pilotage is like finding your way through a town with a street map.)
Scale
Charts come in various scales, and are thereby useful for different purposes. Scale simply means the ratio between the physical distance on the chart and the distance that represents in the real world. If a chart scale is 1:100,000 then one milimeter on the chart represents 100 metres real distance.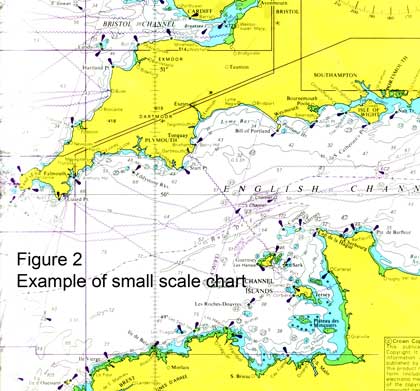
A small scale chart (see figure 2) covers a large area of coastline,and will be useful for navigation between two ports some distance apart; a large scale chart (see figure 1) covers a smaller area but with greater detail - useful for pilotage into or out of port, for example.
On charts that cover large areas, the scale may be slightly different on different parts of the chart (see the section on Projections, below), but don't worry about that for everyday coastal cruising charts.
Chart Plotters
Charts can either be printed, or provided in electronic form for display on chart plotter screens. Neither is "better" than the other: chart plotters can provide very useful functionality, but paper is more reliable (and simpler to learn how it works) so makes a useful backup even if you have a chart plotter.
In practice, some people love chart plotters because they make life easier (they will probably be integrated with the GPS to show your actual position, for example), others hate them because they are overly complicated; it's up to you, but you are going to have to understand the principles of chartwork and navigation whatever you use. On top of that, if you use a chart plotter, you are going to have to study and practise how to operate your particular machine.
In this chapter no distinction is made between the modes of display, because it does not affect what the chart is trying to do. And we don't advise you about chart plotters, because that kind of advice depends on what your particular needs are.
Special Charts and Projections
The vast majority of charts that you will come across are Mercator or Transverse Mercator projections. You can draw a bearing or course as a straight line, and the direction it represents is constant all over the chart.
When someone makes a map, the earth (which is a slightly irregular sphere in shape) has to be represented on the flat surface of a piece of paper. There are various methods of doing this, and all involve slight distortions of one kind or another. The methods are known as projections, and there are dozens of them.
The distortion associated with a mercator projection chart is that the scale will increase with latitude, in order to keep directions constant, and latitude and longitude lines parallel to the edges of the chart. Because of this, when measuring distance on the chart, get used to using the part of the latitude scale that is approximately at the same level on the chart as the area where you are measuring.
Another feature of a mercator projection chart is that, with very small scale (large area) charts, the shortest distance between two points is not a straight line on the chart.
If you are only intrested in a relatively small area of the earth (a few tens of miles) the effect of the distortions is minimal, because the earth can be regarded as pretty well flat over the area in question.
For larger areas (say, a chart from the UK to Spain, or covering the whole width of the Atlantic Ocean) the distortions are greater, so when using these charts it matters more that you understand the distortions. By definition, this affects people who are going to sail longer distances! For this reason we ignore it in this chapter, and cover it in Chapter 6.
In Chapter 6 we discuss:
• a different projection - Gnomonic - which can be used to plan long distance sailing
• Pilot Charts, which contain a wealth of information about the different conditions (weather, currents) to be found in certain oceans at different months of the year.
Chart Datum
As explained in Chapter 1, charts are drawn using a number of different chart datums in different parts of the world.
Basically, the definition of latitude and longitude is not identical on all charts, largely because the Earth is not a perfect sphere. Differences are relatively small, but large enough to cause problems if your GPS is set up on the "wrong" chart datum.
So one of the first things you do when using a chart is check what datum is being used so that you can set the GPS to the same datum. That way, GPS positions can be plotted directly onto the chart. The datum will be clearly stated on the chart; the next section (Admiralty Charts) tells you where to find notes and general information like this on Admiralty charts.
Of course if you are not using GPS to navigate on the chart, and are perhaps fixing your position with position lines, the chart datum doesn't matter. But it could still cause problems if you are plotting a latitude and longitude from a pilot book or almanac (they are very fond of giving you waypoints, although I prefer to choose my own), or if you read a position off one chart and plot it onto another one with a different datum.
Fortunately in the UK we seem to be standardising on a datum called WGS 84, and if every chart and other reference sticks to that, and you set your GPS to it, you don't have a problem.
Charts Versus Reality
Over-reliance on a chart is just as unwise as over-reliance on any other single source of navigational information. I recently read a pilot book which said that a rock had been discovered "in the traditional way" in the middle of what was previously thought to be a safe fairway.
In the UK we are blessed with very high quality charts based on recent surveys, but even these can contain some surprising errors, or make some "interesting" decisions about what they include or don't include.
Charts are regularly updated, and it is as well to have them corrected (corrections are published for the standard Admiralty charts, and a charting agent will correct your charts for you) or to buy the latest versions. Admitedly, the things that change the most are "human" arrangements like navigation aids, and it would be surprising to say the least to discover a previously uncharted rock in Plymouth Sound or the Solent.
Many charts also include data from nineteenth century leadline surveys (the sources of survey data are shown on Admiralty charts, so look for yourself) and in those days surveying was a much less exact science than it is today.
The further you are off the "beaten track" (and tracks are beaten mainly by commercial shipping) the more you ought to exercise caution about what is charted where. It is no comfort to know that your chartwork was "right" when you hit a rock or coral head (coral can grow quite a lot in 200 years, and the reef was surveyed long before the advent of GPS).
Use your common sense and your eyes. When using a chart plotter, you can "zoom in" until it looks, on the plotter, as if you have masses of room to manoeuvre in. This is a total illusion, and the uncertainty both in your GPS position and in the position of the charted objects would also look pretty big if your chart plotter was able to show them at such a huge magnification. (Perhaps manufactuers of chart plotters should be encouraged to show "fuzzy" positions when excessive magnifications are used.)
Whenever you use a chart, look at the scale and keep an idea in your head of the charted distances you're looking at.