2.3 Tidal Streams - Information and Prediction
What Are Tidal Streams?
Tidal streams are movement of the water caused by the flood and ebb of the tides.
Clearly, if high water is going to occur at some time in Dover, the water has to get there! It does this by flowing up the English channel and down from the North Sea.
So in the middle of the Channel or North Sea the water will move back and forth in time with the tides.
Inside an estuary or narrow bay it is pretty obvious that the water has to flow in when the tide is flooding (rising towards high water) and flow out again on the ebb.
Off the coast the timing is much more difficult to predict, because high water occurs at different times in different places along the coast. So at a particular time the water can be flowing in a westerly direction at one end of the channel, an easterly direction at the other end, and be stationary (slack) somewhere in the middle.
But - complex though it is, the pattern will repeat itself in time with everything else - in particular it will repeat itself in time with high tide at a particular place (like the tray of water that is being tipped back and forth in a regular rhythm).
So once we know the tidal stream patterns, we can predict them over a wide area, all related to the time of high water for one place.
Tidal Stream Atlases
A tidal stream atlas shows the flow of water in an area of sea. Because this changes over the 12 hour tidal cycle it shows 12 or 13 “snapshots” of what the water will be doing at hourly intervals.
The hourly snapshots are usually given for one, two, three, four, five and six hours before and after the time of high water at a particular place. On a given day you can look up the time of high water at that place, and then write into the tidal stream atlas the actual time for each “snapshot”. 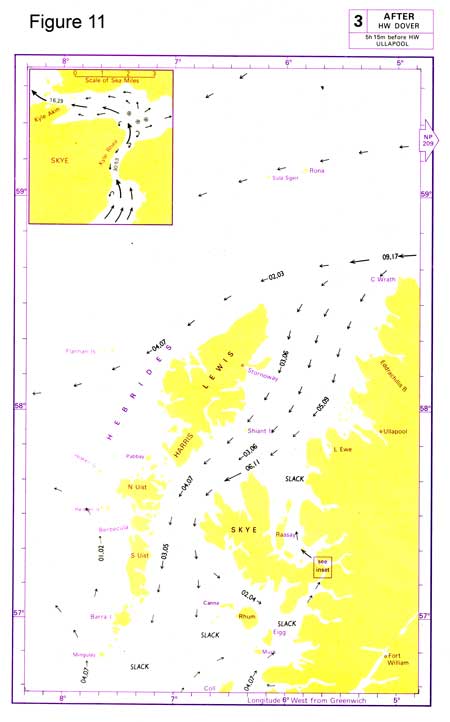
Figure 11 shows a typical page from a tidal stream atlas. It gives the place where the atlas is referred to (Dover), and arrows showing the flow of water at three hours after high water Dover. The numbers are the rates of flow in tenths of a knot, for neap and spring tides (you would expect the streams to be stronger when the tides are bigger).
Thus in a position just off the northern tip of Skye, where it says "06,11" the stream is in a south-westerly direction, 1.1 knots at springs and 0.6 knots at neaps.
You estimate the speed of the tidal streams when the tides are between springs and neaps (a table is provided in the back of the atlas if you want an accurate estimate).
Don’t worry that Dover is not even in the area concerned. The tidal streams can still be successfully related to high water times at Dover because the tide everywhere (Dover, the Hebrides) oscillates in time with the same tidal forces.
Tidal Stream Information on Charts
Sometimes the available tidal stream atlases don’t give very much large scale detail in the area you are interested in, so there is another very useful source of prediction information which is printed on charts.
A few charts include their own mini tidal atlases for the local area.
And most Admiralty charts include very detailed tidal stream predictions for particular positions where the streams have been observed.
The symbol for this position is a letter enclosed in a diamond, printed magenta, known as a tidal diamond. For each of these positions tidal data is given in a table on the chart.
Figure 12 shows an example, and the points to note are: 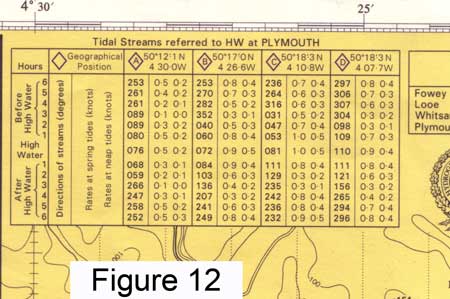
• the port to which the data is referred is clearly stated (in this case Plymouth)
• tidal stream data is tabulated for each hour, from six hours before to six hours after high water at that port
• the tidal stream data starts with the direction of flow (printed bold)
• it then states the rates of flow in knots, at spring tides and neap tides
• these are “snapshots” of what is happening on each hour (the actual speed and direction of flow changes smoothly and continuously between the tabulated "snapshots")
So if you are interested in the tidal stream at tidal diamond C (which is marked on the main chart at the position given in the table) four hours after high water at Plymouth (Devonport) on a spring tide: it will be flowing in direction 242 ° (True) at a rate of 0.8 knots.
Obviously you will need to estimate (interpolate) the rate if you are somewhere between spring tides and neaps. This can usually be done in your head accurately enough for our purposes.
Another tip: if you want to find out what time slack tide occurs, look at the change of direction on these tables. The “snapshots” of data won’t always show one that is exactly on slack i.e. a rate of zero, but the direction tells you what is really happening, i.e. when the flood turns to ebb and vice versa.
For example, in Figure 12 tidal diamond A shows slack with the tide turning from west-going to east-going between four and three hours before HW, and the next slack (east-going to west-going) somewhere between 2 and 3 hours after HW.
If the time of slack tide is particularly important to you e.g. for diving, remember that these are only predictions, and may not be spot-on accurate - they will depend on the weather anyway. So show up early, make sure the tide is flowing the way you expect it to be before slack, and wait for slack.
Thinking About What’s Happening
The general pattern of tidal streams will be a flood for approximately six hours, followed by an ebb for the next six hours.
The sources of tidal stream information will give the ability to accurately predict the flow in some places, but perhaps the more important thing is to study this information to get a general picture of what is happening at a particular time and over the full 12 hour tidal cycle.
You can imagine the way the water is flowing, and it is not surprising that it will be flowing faster round headlands, or be relatively slack in a protected bay.
Close in, the general direction of flow will be parallel to the coastline.
In an estuary it will flood into, and ebb out of, the river.
It’s important to visualise the flow of the tidal streams and do “common sense” checks of the tidal predictions, because it is all too easy to make an error in the prediction calculations if you are concentrating too hard on the numbers and not the overall picture.
These are practical skills, which you can learn at sea.