2.2 Tidal Heights - Information and Prediction
So much for the theory of the tides.
What we want to be able to do in practice is predict a) how deep the water is and b) how fast it is moving at any given time. This section outlines all the sources of tidal information and explains how you use them.
However before we start, let us look at the tidal terms that are used so that we can fully understand the information as it is given to us.
Tidal Terms and Explanation
First high water and low water.
This refers to when the tide is fully “up” and fully “down”. We talk about the time of high or low water, and the height of high or low water.
Next tidal range.
This is the difference between the heights of high water and low water at any particular place. It is generally given in meters. As explained above, the range is greater at spring tides and smaller at neap tides (spring range is greater than neap range).
If we want to work out the depth somewhere at a particular time, what we need is to know:
a) what is the absolutely minimum depth that can ever happen, and
b) how much extra depth we are getting because the tide is part way up.
The first part of this is very easy, because it is the depth that is printed on the chart (charted depth). 
Depths are referred to the level of chart datum, which is the level of lowest astronomical tide (LAT): i.e. the lowest low water that we can ever expect in normal circumstances. Figure 5 illustrates this.
A note in passing: the weather can affect the height of the tide but this generally by a small amount, and difficult to predict. So we tend to ignore it. Lowest astronomical tide means the lowest tide caused by the moon and sun, but the water could get even lower in exceptional weather.
The extra depth we get because of the tide is called the height of tide at the particular time we’re interested in, and the following sections work out how to predict this.
So then the actual depth will be: charted depth + height of tide.
There are some places on the chart which are above the water when the tide is low. For these places the chart needs to tell you the “depth” at LAT, and of course in this case it will be a negative depth. It is marked as such on the chart by underlining it, and it is called the drying height. Figure 5 illustrates this.
One more set of terms for completeness:
• mean high water springs (MHWS)
• mean high water neaps (MHWN)
• mean low water springs (MLWS)
• mean low water neaps (MLWN)
This idea is pretty simple. It is convenient to know roughly how high and low the tide goes at a particular place, so the average heights of high and low water can be quoted for both spring and neap tides.
Figure 6 shows how these heights relate to each other.
You can use this information to tell you some things you might want to know: for example, the MHWS added to the charted depth at a particular place shows the average depth you will get there at high water on spring tides - approximately the greatest depth you are ever going to get there.
Use MLWS and it will tell you approximately the least depth you will ever get.
Finally when the tide is coming in we call it flooding, and when it’s going out it’s ebbing.
Tide Tables
Tide tables are the basic source of information to predict tidal activity. They are published for all major ports and other places of particular interest. (It would be possible to do a tide table for anywhere, but it’s clearly impractical to publish millions of tide tables.) Places with tide tables in the almanac are called standard ports.
The table shows, for each day of the year, the height and time of high water and low water. 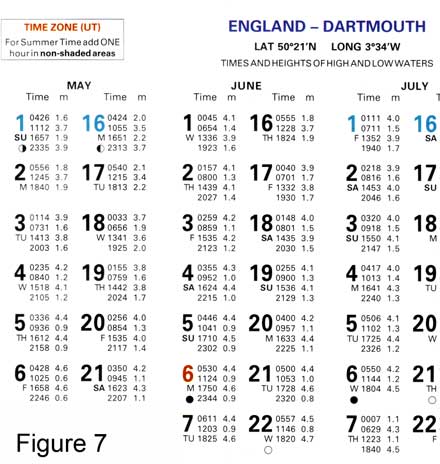
Figure 7 shows this for Dartmouth. Note that it doesn't say High Water or Low Water - this is inferred from the heights. So on Thursday 2nd June, High Waters are at 0157 and 1439.
This also allows you to calculate the tidal range for that day:
• range = height of high water - height of low water.
On 2nd June in the morning the range is:
4.1-1.3=2.8m.
This publication also indicates Neap tides by colouring the date blue, and Spring with red: it also shows the phase of the moon, so you can see how these are connected to springs and neaps. It's worth looking at the ranges at Spring and Neap, to get an idea how large the tides are in this particular location (they're very different in Dartmouth and, say, St Malo).
At the top of the table it will tell you the time zone that the times are quoted in. Generally for the UK this will be universal time (UT). (UT is the same thing as GMT.) In order to get British Summer Time (BST) you will have to add an hour.
Tidal Curves
You have been given the height of tide at four times (quite important times) in the day, but you may need to predict the height of tide at some other time, between low water and high water. 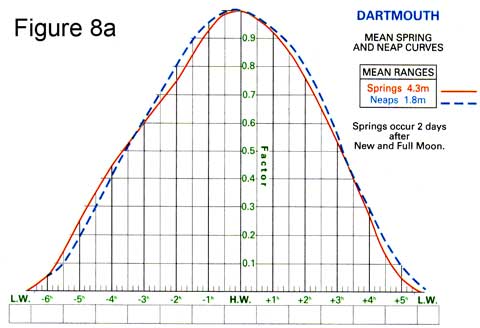
This is done with a tidal curve, and Figure 8a shows one. It shows how the height of tide changes with time. It is a similar smooth shape as the "ideal" tidal curve, but is not entirely regular - this particular place (Dartmouth) behaves slightly differently to other ports.
Note also that the shape of the tidal curve is slightly different in this case for springs and neaps.
A tidal curve is often published in the almanac for ports that have tide tables.
Using a Tidal Curve
The important thing about the curve is, it’s the same shape regardless of the exact times or heights of high and low water. So all we have to do is use the scales on the graph to show the heights and times for the particular day we are interested in.
Figure 8b shows how we do this, with the tidal curve published for Dartmouth.
We'll use the data for 18th June: LW (1.5m) at 0801; HW (3.9m) at 1435; LW (1.5) at 2030. 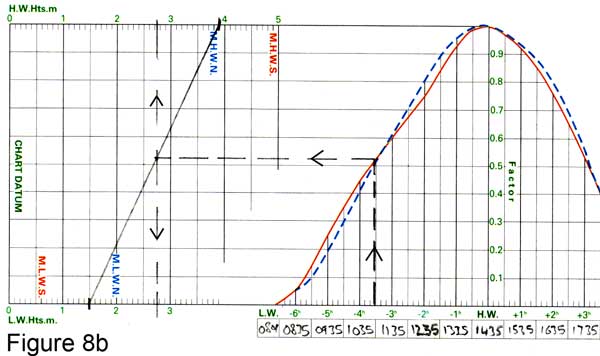
For the time scale, just write the time of high water (1435) in the middle time box, and then fill in the other boxes for each hour before and after high water.
We then need a way of getting the height scale. Mark the height of low water (1.5) on the bottom scale to the left, and the height of high water (3.9) at the top. Then draw a straight line between them, and that is our height scale for the day: any height between low water and high water can be read off the top or bottom scale.
So: to predict the height at 1100:
• find 1100 on the time scale
• go up a vertical line until you get to the curve
• go across until you get to the line which gives the height scale
• go up (or down) to read off the height between low water and high water heights - just over 2.7m.
Keeping It Real!
It's important to understand how to do these things, but please don't go overboard about it - don't waste time and effort on useless accuracy!
For one thing, tidal predictions are only approximations at the best of times, and that in complex tidal areas they are even more approximate. Secondly, the weather affects the height of tide (e.g. high atmospheric pressure pushes the water level down, and a low pressure system will pull it up) and this can't be readily predicted. Then just think how uneven the sea bed is anyway, with old moorings and rocks strewn around. That, and the waves, make a mockery of predicting tidal heights to the nearest tenth of a meter or minute of time.
When you do this in practice, you will get a better feel for how precise you want to be. If, for example, you are working out when you will have enough water to get into a particular port, then give yourself a generous margin of time, and an extra meter under the keel - it takes the pressure off you!
Secondary Ports
Secondary ports are those places which don’t have tide tables in the almanac.
Nevertheless we want to make predictions of tidal heights near them, so we use a tide table for the recommended standard port and make some adjustments to the numbers.
Figure 9 shows some typical data for a secondary port. By the way, you might want to open this figure in a separate window (double click it) to follow all the explanation that goes with it.
The first line on tides is pretty crude information for predictions. It assumes you only have a tide table for Dover, and tells you that on average high water occurs “-0550 on Dover”, i.e. 5 hours fifty minutes before Dover; that the mean level (mid way between high and low) is 5.5m; and that duration is 0605, which means that low water occurs about 6 hours 5 minutes before the next high water. ("Zone" is time zone - 1 hour ahead of UT). 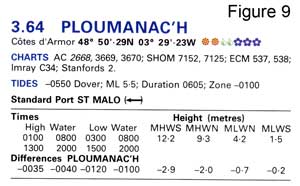 Ignore this first line - unless you've only got Dover tide tables.
The next line tells you which standard port to use, in this case St Malo (the arrow just shows where to look for St Malo's tide table in the book). The table below tells you the differences between the numbers given in the St Malo tide table and the corresponding numbers for this secondary port.
The differences are not constant. The time differences depend on the approximate times of high and low water at the standard port, and the height differences depend on whether we are on spring or neap tides.
So in figure 9, the difference for the high water time is between -0035 and -0040, i.e. Ploumanac'h high water is between 35 and 40 minutes before St Malo. When high water St Malo is at 0100 or 1300, the difference at Ploumanac'h is -0035 ; when high water St Malo is at 0800 or 2000 the difference at Ploumanac'h is -0040. When the HW time is somewhere in between (which it usually is) the difference is somewhere between -0035 and -0040.
Low water works in exactly the same way. The time difference is somewhere between -0120 and -0100: -0120 if low water time at St Malo is 0300 (or 1500) and -0100 if it is 0800 (or 2000).
The height differences also vary, this time according to whether the tides are springs or neaps or in between. At high water springs, the difference in height at Ploumanac'h is -2.9; for high water neaps the difference is -2.0; between springs and neaps, the difference is between these two numbers.
For convenience, the table gives you MHWS, MHWN, MLWN, MLWS at St Malo, and this helps you to see how close you are to springs or neaps when you look at the St Malo tide table for the day. And it also lets you work out MHWS, MHWN etc for Ploumanac'h: MHWS is 12.2 - 2.9 = 9.3m and so on.
For low water, the difference lies between -0.7 at neaps and -0.2 at springs.
So we need to work out the differences - then, starting with the day's tide table entry for St Malo, we apply those differences and so construct a tide table for Ploumanac'h.
Using Secondary Port Information
The most difficult thing about using this data is the interpolation: we need to interpolate between the times of high and low water at the standard port to get the time differences, and between spring and neap tides to get the height differences. But very often, it's not terribly important to be accurate.
In Ploumanac'h the time difference for high water is between -0035 and -0040, depending on the time of high water at St Malo. Big deal! When are we going to need that kind of accuracy? Estimating to the nearest five minutes is ample.
The issue is a little more significant for the time of low water: the difference we need to calculate is somewhere between 1 hour and 1 hour 20 minutes.
Still, we can approximate: say the St Malo LW on a particular day is 0423. We need to estimate where this lies between the times in the table, 0300 and 0800. 0423 is roughly a quarter of the way from 3 to 8 (you can estimate this with numbers, or just sketch a "scale" from 0300 to 0800 and mark 4 hours 23 minutes on it - or look at it on the face of your watch). So the difference we want is a quarter of the way from -0120 to -0100, and we therefore estimate -0115.
Similar approximations can be made for the height differences.
When you are somewhere between springs and neaps, just approximate the difference to apply: between -2.9 and -2.0 for high water - quite a simple job, given that there is only 0.9m between them (in practice estimating to the nearest half metre is often good enough, because you have to leave a safety margin anyway). The low water differences are even closer. 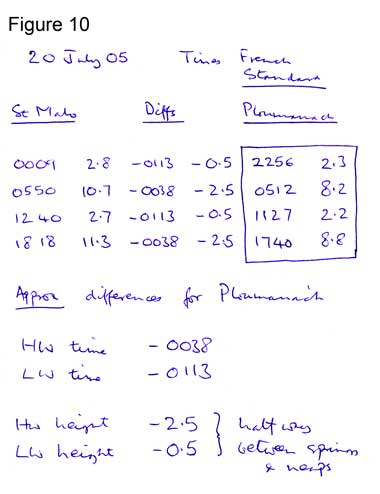
Once you have estimated the actual differences for the day, you can use the data to convert the standard port tide table to produce the equivalent information for the secondary port.
Figure 10 shows a worked example. The numbers under the heading St Malo are copied from the tide table: differences are worked out using the secondary port information in Figure 9, and are applied to St Malo's times and heights.
It is highly recommended that you write the workings down in this way, so that you (or someone else) can check them.
Given that you have the tide table information, you can borrow the tidal curve from another port to make tidal predictions between high and low water. Have a look at the curve for the standard port, or indeed for other ports that might be closer along the same stretch of coast and therefore more representative of the secondary port.
Using a suitable curve, put in the “tide table” data worked out for your secondary port and do exactly as described in the section above on using tidal curves.
Complex Tidal Areas
There are some areas of the coast where the tide does not follow simple patterns, and the almanac will generally provide as much guidance as it can.
One example is between Swanage and Selsey on the south coast of England. For these areas the almanac offers some alternative methods, together with a collection of irregular-looking tidal curves, generally worked off the time of low water rather than high.
The tide table for Poole gives time predictions for low water only, and the tidal curves for Poole Town Quay vary quite considerably according to the height of low water. Since the tidal ranges are pretty small it is doubtful whether it is worth spending very much time trying to make accurate predictions.
It is best to study the almanac itself for these somewhat exceptional methods for making tidal predictions. Once you know the basics, you should easily be able to understand the other methods.