5.3 Wide Area Weather - How it Works
Wide Area Weather Systems
In the previous section all the phenomena we talked about were "local", i.e. affecting a relatively small area.
This section describes much larger features, hence the weather forecasters are much more able to observe them and predict their behaviour. The larger features are what drives the general wind, or gradient wind, that we have referred to in the previous section in contrast to the "local wind".
A word about why we are interested in this. After all, weather forecasters can tell us predicted wind strengths and directions, can't they?
Well there are a few reasons. First, "grown up" long range forecasts, weather faxes and so on, use weather maps, and we want to be able to interpret these. Second, if we understand how a "weather system" works, then we can better interpret what is actually going on in our location. For example, the passage of a front can be very obvious and visible, and when the rain stops and the sun comes out, it would be nice to know what the wind is likely to do. We can also observe the barometer, and if we know what we are looking for, that can give us useful information about what is happening (or is about to happen).
Basic Physics
In addition to the physics facts stated in the previous section, here are two more which have particular relevance to what follows:
9 Water vapour is absorbed by air passing over oceans. Air which passes over continental land is considerably drier.
10 Over a wide area (a hundred miles or more) the pressure or air at the earth's surface can vary, and the air does NOT flow directly from the place of high pressure to the place of low as you might expect. Instead, it spirals round an area of low (or high) pressure (like a giant version of the circulation above the plug hole when the bath water drains out). This circulation is caused by the rotation of the earth, and occurs in the opposite direction in the north and south hemispheres.
The following sections go into that last fact in a little more detail.
Surface Pressure and Isobars
Physics fact 10 mentioned that there is a variation of surface pressure over a wide area. There is a direct link between pressure variation and wind, so it is worth understanding what the link is, and how pressure variations are shown on weather maps.
Surface pressure is measured in milibars - one bar, or 1000mb, being approximately the average pressure of the atmosphere - and the pressure usually ranges between about 960mB and 1040mB. (If you come across hectopascals, this is in fact exactly the same measurement as milibars.) 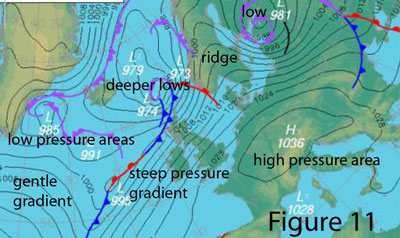
On weather maps or synoptic charts, places of equal pressure are joined together by isobars (the word just means "same pressure"), which show the atmospheric pressure in exactly the same way as contours show the height of the ground. In fact it helps to visualise isobars as "pressure contours", with dips, valleys, ridges and high areas representing low and high pressure areas instead of low and high ground. Quite a lot of the same terms are used; for example we talk about a pressure gradient in the same way as we refer to the gradient of sloping ground. Figure 11 shows this.
Wind and Isobars
One's initial instinct is to think that air should move straight from a place of high pressure to the place of low pressure and even everything out. But in fact there are two reasons why these pressure differences can exist, and why air in motion will have a pressure gradient at rightangles to the direction of motion - and will not (cannot) move in the direction of the pressure gradient. 
The first applies to air (or any fluid or object) moving in a curve. Anything moving along a curved path is actually accelerating, because its velocity (which means speed AND direction) is changing.
By Newton's laws of motion, a force must be applied at rightangles to the direction of motion to cause this acceleration, and in the case of atmospheric air, this force is the pressure gradient.
(A special case of this is the vortex - constant circular motion round a central low pressure area, just like bath water going down the plug hole.)
See Figure 12.
There are hundreds of examples of this in everyday life: the sideways force you feel when you drive a car round a corner, the force you apply on an object when you swing it around you on a rope, etc.
 The second is less obvious and applies to any movement of the air on the earth's surface, straight or curved. Because of the rotation of the earth, the air experiences a force called the Coriolis force, at rightangles to the direction of motion. (This force is greater at higher latitudes and negligible near the Equator.)
So if air is moving in a straight line over the earth's surface, then a pressure gradient must exist at rightangles to the direction of motion, to balance the Coriolis force. The Coriolis force acts to the right in the northern hemishere, and to the left in the southern hemisphere.
Coriolis is the force you need to "invent" to explain motion on a rotating frame of reference - the earth's surface. The earth's surface doesn't seem to us as if it is rotating, which is why we are happy to use it as a "stationery" frame of reference, and we don't encounter the Coriolis effect every day. But try walking in a straight line on a children's roundabout, and you will get the idea.
See Figure 13.
Fascinating though all this is, that's all the explanation you are going to get here. The important question is, what does this mean in practice?
• the wind blows very nearly parallel to the isobars (angled very slightly towards the low pressure, and more so where surface friction is slowing it down)
• the wind direction is anti-clockwise round a low pressure system, and clockwise round a high pressure area, in the northern hemisphere. "In north latitudes, face the wind and the barometer will be lowest to your right" (Buys Ballot's Law). It goes in the opposite direction in the southern hemisphere. 
• the greater the pressure gradient, (i.e. the closer the isobars are together) the stronger the wind.
This means that you can look at a weather map and tell from the isobars what the wind strength and direction will be. See Figure 14.
As noted in section 2 on weather forecasts, we have special words to describe the change in direction of the wind, called veering and backing. Veering (sometimes called "clocking") is when the direction from which the wind is blowing changes in a clockwise direction, for example west - northwest - north. Backing is the opposite, e.g. west - southwest - south.
Air Masses and Fronts
A good deal of our weather is caused by the meeting of air masses which have different origins and therefore different characteristics: amount of water vapour contained in them, and temperature (and hence density). Examples are the air mass which has formed over the North American continent, which in winter is cold and dry: and the air mass from the tropical Atlantic ocean, which is warm and contains a large amount of water vapour (i.e. "wet").
The line along which two such air masses meet is called a front. The military metaphor is well chosen, because there can be quite a bit of "conflict" between the two air masses - and quite severe weather. This is because the air masses tend to push into each other, and because of the temperature difference, quite a lot of energy is available to generate strong winds and rain.
Say you have two air masses pushing into each other (see Figure 15). Where the warm wet air pushes into the cold air, it is called a warm front - and has a special symbol on weather maps. If the cold air is pushing into the warm it is called a cold front.
From the side, the front isn't straight up and down. The cold air is heavier - more dense - than the warm (physics fact 4), so with a warm front the warm air rides up over a wedge of cold air. Similarly the cold air of a cold front pushes underneath the warm air. Consequently, the two fronts have slightly different weather characteristics, described below. Remember, though, that fronts are not always "perfect" and conditions can depart somewhat from the descriptions in the textbooks (which the weather systems haven't read). The main things to remember are:
• fronts generate stronger winds and rain (the energy comes from the temperature difference between the air masses, so the greater and sharper the difference, the more violent the weather)
• as the front passes you, the wind direction and the air temperature will change: it will get warmer with a warm front, and colder with a cold front, and the wind will normally veer. The barometer will stop falling and/or start rising.
• as the front moves away from you, the wind will normally ease, and the rain cease or become showery.
The sequence of weather as a frontal depression passes you is described in the next section, but it is worth noting here the main differences between warm and cold fronts:
• a warm front is preceded by 100% cloud cover, gradually thickening and getting lower, and drizzle intensifying into heavy rain
• a cold front will generally feature heavy squally rain, followed by heavy showers with clear intervals (and greatly improved visibility).
Atlantic Depression
In the UK, the weather system that causes most of our wind and rain is the Atlantic depression, a frontal low pressure system that forms over the North Atlantic and usually (because of the broader global wind circulation patterns) heads east or northeast towards Europe. (It's sometimes just called a low or Atlantic low.) It is well worth understanding how this weather system works, and how its features are portrayed on weather maps. 
It starts with the two air masses mentioned above. They meet along a line which is typically just off Newfoundland (it moves around a bit). If the warm air to the south is moving north east as shown in Figure 6, and if the cold air is moving more slowly or the other way, conditions are right for a depression to form. There is a pressure gradient associated with this movement, as explained above.
A small wave-like disturbance develops on the frontal boundary between the two air masses. This then starts to circulate (due to the Coriolis effect), and a pressure gradient develops, with low pressure in the middle of the circulating air.
The system now develops and deepens (lower pressure in the middle) and two distinct fronts form as part of the system. The system as a whole moves with the approximate speed and direction of the warm air.
By the time it reaches the UK, the depression typically looks like Figure 17.
The whole sytem is moving. As it tracks across us (for example, suppose the dashed line ABCDE tracks over our position) we experience the following sequence of weather as each of the points marked on the line reaches us.
A: warm front approaching. The sky gradually becomes overcast, starting with high clouds and eventually with low grey overcast and drizzle turning to rain. Wind increases and backs.
B: passage of warm front. As it passes and moves away, the wind veers and eases, and the rain stops.
C: warm sector of the depression. Perceptably warmer, with cloudy conditions and perhaps low visibility, occasional light drizzle (the further away from the "tip" of the warm sector you are, the better the weather conditions)
D: cold front. Wind increases and backs, rain becoming heavier. As the front passes the wind suddenly veers, and temperature falls. Heavy rain continues for a period, and is then replaced by heavy showers with bright intervals.
E: showers become more infrequent and weather fairer. Wind decreases. Good visibility.
Two further things to note: in area F, exactly the same conditions exist that we described for the initial formation of the depression. It is unsurprising, therefore, that a new depression seems to be forming here. This is something to bear in mind when you look at the forecasts: just when you think one depression has cleared past, another forms in its wake! This is called a secondary depression and it can happen several times.
Our system also has a new type of front (see G), called an occlusion or occluded front. This usually forms when a cold front (which often travels faster) catches up with a warm front, and from the side it looks like Figure 18. Needless to say the associated weather is heavy rain!
Sometimes weather forcasters call on our knowledge of these systems (!) when predicting the wind direction. Suppose they predict, for example, that the centre of the depression in Figure 17 is going to track eastwards across the centre of sea area Hebrides. If you happen to be at the northern edge of the area, the low will pass to the south of you, so the wind will be south to begin with, and back: southeast - east - northeast. In contrast, if you are to the south of the area and the centre's track, you will get south or southwest, veering west then northwest. And if you are dead on the track of the centre, you could get an abrupt shift from southerly wind to northerly as it goes through your position. So what is the forecaster to say about the wind direction in sea area Hebrides? Answer: he describes it as cyclonic, which means exactly what I have just described.
Anticyclone
The anticyclone, or High, is an area of high pressure and the weather is a total contrast to the Atlantic depression.
Generally speaking, no fronts are involved (although you will see weather maps where fronts just happen to have ended up in or near areas of high pressure). Generally speaking also, winds are light near the centre of an anticyclone. But the pressure gradients can be quite steep - and the wind consequently quite strong - on the edge of a high pressure area, particularly if there is a deep low pushing into it.
Because there are no fronts the weather is generally fair, and the skies very often clear. Again there can be exceptions, e.g. where thicker cloud is left over from other weather systems, and you can get light rain or drizzle - the weather forecasters often find it quite hard to predict where this will happen. In the winter, the clear skies often result in frost (particularly at night) and fog, and because the air is pretty static you often get haze and smoggy conditions building up with prolonged anticyclonic conditions, until a depression comes along and literally clears the air. 
Figure 19 shows an example of an anticyclone. Remember that the wind circulation is still nearly parallel to the isobars, and it is stronger where the isobars are closer together (i.e. the pressure gradient is steeper). Remember also (from the section on wind and isobars) that the wind circulation is clockwise round an anticyclone in the northern hemisphere.
So in area A, you have fair weather with a light north-easterly wind. At B you have fair weather too, but a much stronger south-easterly because of the depression pushing in from the west. The dashed line at C is described as a ridge - an elongated area of high pressure stretching across the north of Scotland to Scandanavia. For logical reasons you often get a ridge extending between two depressions, giving a brief respite of fair weather before the next depression arrives. Note that the Western Isles of Scotland may have a bit of cloud and light rain associated with the end of that warm front.
Conclusion
That describes the main features of wide area weather that you will hear the forecasters talking about.
Incidentally, you may wonder what the short black lines (which aren't marked as fronts) mean on these synoptic charts. A weather forecaster once told me that when they could see a "bit of weather that they couldn't explain", they put a line through it.
There's an example in Figure 11 and three in Figure 19. Short of remembering to take an umbrella, I'm not sure how you are supposed to interpret these ...