Introduction
Most people are familiar with the idea of tides. The sea comes in over the sand when you are on the beach, and then goes out again. Tides are of particular interest to yachtsmen because of two distinct facts:
• the depth of water at a particular place (or whether it's out of the water altogether) changes, and it is important to know the depth in order to avoid going aground
• tides cause movement of the water, and it is important to know about this in order to navigate (described in the Navigation section). And sometimes, the water’s movement can create a dangerous environment for the boat.
The good news is that these effects are predictable. Because they are important to mariners, tidal heights and movement have been carefully observed over the years, and predictions published. From this we can get tidal information about the exact places and times we are interested in.
What Causes the Tides?
The earth’s tides are caused by the gravitational pull of the moon and the sun. The pull of gravity is what keeps the earth and moon revolving round one another, and what keeps this pair revolving round the sun.
 Gravity is stronger the closer you get to the object causing it. With the moon, which is quite close to us, this is significant; at the side of the earth which is closest to the moon its gravitational pull is stronger, and at the opposite side of the earth the moon’s gravitational pull is correspondingly weaker.
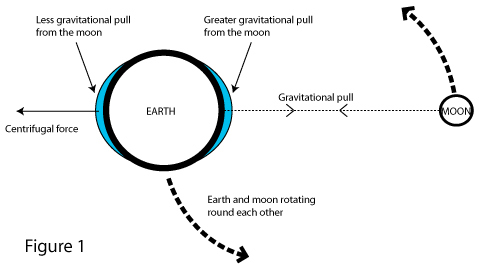
On land, nothing can really move in response to this difference is gravitational force, but water can move. What it actually does is form two bulges in the oceans: one on the side facing the moon and the other on the opposite side as shown in figure 1 (we're looking down on the earth from above the north pole).
The one on the side closest to the moon is caused because the stronger gravitational pull attracts the water. The one on the furthest side from the moon side is caused because the centrifugal force (which here is stronger than the gravitational force) throws the water outwards as the earth rotates around the moon (remember, they rotate around each other, even though the earth is much closer to the centre of this rotation). Note that the figure is not to scale.
The earth also spins on its axis. It takes 24 hours for each point on the earth to get from one noon (i.e. facing towards the sun) to the next noon. It takes slightly longer (about 24 hours 50 minutes) between successive lunar noons, because the moon moves with respect to the sun - it rises a little later each day.
In this 24 hour 50 minute period each place will experience the forces that cause the two tidal “bulges” mentioned above, i.e. in general, two high tides and two low tides.
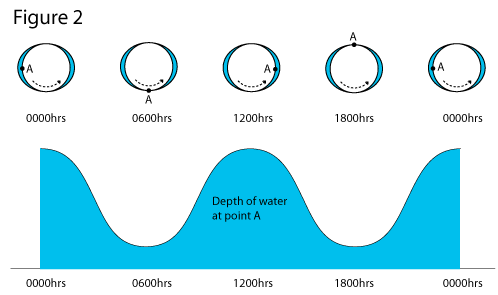 The typical pattern is shown in figure 2, where once again we are looking down on the earth from above the north pole. (To make the numbers simpler, I've shown a 24 hour cycle). Note the two high tides and two low tides in the 24 hour period.
This tidal pattern is called semi-diurnal, meaning “every half day”. High tides are about 12 hours apart.
Another way of looking at it is as a "system" undergoing a regular cycle of forces. Any point on the earth’s surface experiences the full cycle tidal forces from the moon in each 24 hour 50 minute period. This regularly changing set of tidal forces causes the water to oscillate. This is like any object or structure - solid or fluid - which is made to oscillate by a force which has a steady frequency. If for example, you fill a basin with water and then move your hand back and forth in it to a regular rythm, quite an impressive oscillation can build up. Such a system will oscillate at the same frequency as the forces applied to it.
Note also that in figure 2 the water level changes smoothly in response to the forces. This is typical of oscillations and waves of various kinds. There are no sudden jerky movements (it is called harmonic motion).
Complex Tidal Patterns
Life would be very simple if the earth was covered with a single ocean of even depth. Then the tide everywhere would be like figure 2. But the earth is irregular, oceans vary in depth and each ocean basin has it's own natural frequency for oscillations, and also water has to flow in and out of narrow gaps between land masses in order to get to where the high tide is.
So the pattern of the tidal oscillation is quite complicated and differs depending on where you are.
In some places the ocean oscillates so that the two daily tides are quite different in size, and in some places this effect is so pronounced that there is only one high tide per day (diurnal tides).
In most European coastal areas the tide is semi-diurnal, but some parts of the English south coast have a tidal pattern which is very different from the simple harmonic pattern in figure 2. This is usually because of the way the water flows round headlands and in and out of complex waterways like the Solent. You can get double high tides or prolonged stands - periods when the tide does not rise or fall.
But despite that, the system behaves in a predictable way. Wherever you are, the pattern of tides - however complex - will repeat itself in time with the forces that are causing it. You could imagine holding a tray of water with a scale model of the English Channel on it. You tip it slowly one way and the other with a regular rhythm. The water in different places won’t all move at exactly the same time; there will be a delay as the water pushes up the channel and swirls round the corners. But the motion, however complicated, will repeat itself exactly in time with the tipping of the tray.
Spring Tides and Neap Tides
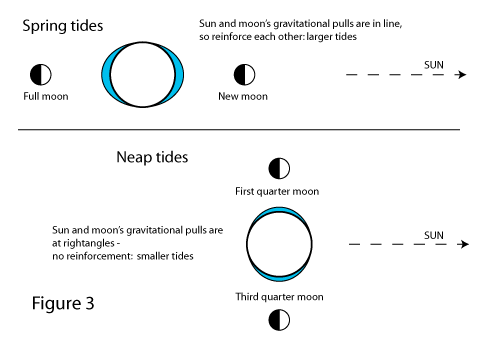 Both the moon and the sun cause a tidal effect. The moon’s is 2.5 times greater than the sun because the moon is closer. When the sun, moon and earth are in line, the tidal effect is stronger because the sun and moon’s tidal forces are combined; the sun and the moon’s “double bulge” effect reinforce each other, an this causes bigger tides known as Spring Tides.
This happens when the moon is full (opposite side of the earth to the sun) or new (same side as the sun), as shown in figure 3. It takes a couple of days for this to produce the largest tides, so they occur a couple of days after the new and full moons.
The smaller tides that occur half way between new and full moons are called Neap Tides.
Figure 4 shows the sequence of spring and neap tides according to the phase of the moon. It takes 4 weeks from one full moon to the next, so spring tides happen every 2 weeks. The size of the tide gradually decreases over the course of one week to become neap tides, then gradually increses again. 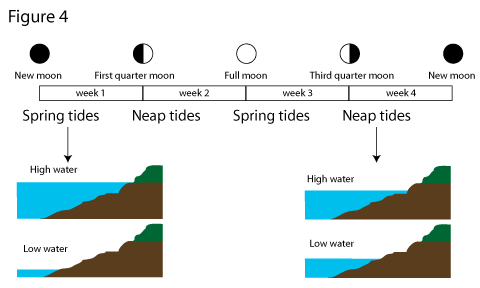
Other factors you need to be aware of are:
• the tides don’t always repeat after exactly 24 hours 50 minutes, because the sun’s effect changes the timing of the tides - sometimes it's less and sometimes it's slightly more
• some spring tides are larger than others (and some neaps smaller) because the earth and moon are not in circular orbits. The orbits are elliptical, so at some times during the year the earth is closer to the sun, causing larger tides.
Tidal Heights - Information and Prediction
So much for the theory of tides.
What we want to be able to do in practice is predict a) how deep the water is and b) how fast it is moving at any given time. The following sections outline all the sources of tidal information, and explain how you use them.
However before we start, let us look at the tidal terms that are used so that we can fully understand the information as it is given to us.
Tidal Terms and Explanation
First high water and low water.
This refers to when the tide is fully “up” and fully “down”. We talk about the time of high or low water, and the height of high or low water.
Next tidal range.
This is the difference between the heights of high water and low water at any particular place, on a particular tide. It is generally given in meters. As explained above, the range is greater at spring tides and smaller at neap tides (spring range is greater than neap range).
If we want to work out the depth somewhere at a particular time, what we need is to know:
a) what is the minimum depth that can ever happen, and
b) how much additional depth we are getting from the tide at that time.
The first part of this is very easy, because it is the depth that is printed on the chart (charted depth). 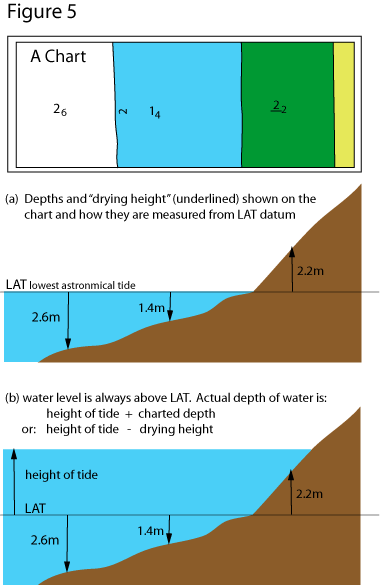
Depths are referred to the level of chart datum, which is the level of lowest astronomical tide (LAT): i.e. the lowest low water that we can ever expect in normal circumstances. Figure 5 illustrates this.
The weather can affect the height of the tide but this generally by a small amount, and difficult to predict. So we tend to ignore it. Lowest astronomical tide means the lowest tide caused by the moon and sun, but the water could get even lower in exceptional weather.
The additional depth we get because of the tide is called the height of tide at the particular time we’re interested in, and the following sections work out how to predict this.
So then the actual depth will be: charted depth + height of tide.
There are some places on the chart which are above the water when the tide is low. For these places the chart needs to tell you the “depth” at LAT, and of course in this case it will be a negative depth. It is marked as such on the chart by underlining it, and it is called the drying height. Figure 5 illustrates this.
One more set of terms for completeness:
• mean high water springs (MHWS)
• mean high water neaps (MHWN)
• mean low water springs (MLWS)
• mean low water neaps (MLWN)
This idea is pretty simple. It is convenient to know roughly how high and low the tide goes at a particular place, so the average heights of high and low water can be quoted for both spring and neap tides.
Figure 6 shows how these heights relate to each other.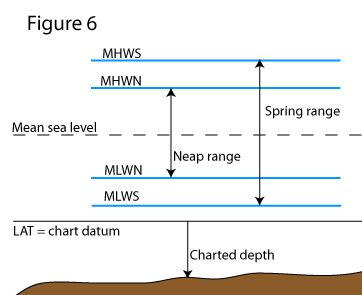
You can use this information to tell you some things you might want to know: for example, the MHWS added to the charted depth at a particular place shows the average depth you will get there at high water on spring tides - approximately the greatest depth you are ever going to get there.
Use MLWS and it will tell you approximately the least depth you will ever get.
Finally when the tide is coming in we call it flooding, and when it’s going out it’s ebbing.
Tide Tables
Tide tables are the basic source of information to predict tidal activity. They are published for all major ports and other places of particular interest. (It would be possible to do a tide table for anywhere, but it’s clearly impractical to publish millions of tide tables.) Places with tide tables in the almanac are called standard ports. 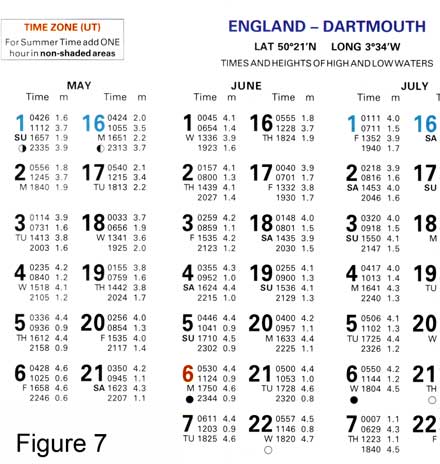
The table shows, for each day of the year, the height and time of high water and low water.
Figure 7 shows this for Dartmouth. Note that it doesn't say High Water or Low Water - this is inferred from the heights. So on Thursday 2nd June, High Waters are at 0157 and 1439.
This also allows you to calculate the tidal range for that day:
• range = height of high water - height of low water.
On 2nd June in the morning the range is:
4.1 - 1.3 = 2.8m.
This publication also indicates Neap tides by colouring the date blue, and Spring with red: it also shows the phase of the moon, so you can see how these are connected to springs and neaps. It's worth looking at the ranges at Spring and Neap, to get an idea how large the tides are in this particular location (they're very different in Dartmouth and, say, St Malo).
At the top of the table it will tell you the time zone that the times are quoted in. Generally for the UK this will be universal time (UT). (UT is the same thing as GMT.) In order to get British Summer Time (BST) you will have to add an hour.
Tidal Curves
You have been given the height of tide at four times (quite important times) in the day, but you may need to predict the height of tide at some other time, between low water and high water. 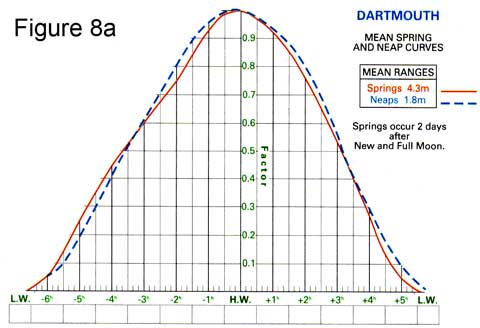
This is done with a tidal curve, and Figure 8a shows one. It shows how the height of tide changes with time. It is a similar smooth shape to the "ideal" tidal curve, but is not entirely regular, and tidal curves are different in different places.
Note that in this case, the shape of the tidal curve is slightly different for springs and neaps.
A tidal curve is often published in the almanac for ports that have tide tables.
Using a Tidal Curve
The important thing about the curve is, it’s the same shape regardless of the exact times or heights of high and low water. So all we have to do is use the scales on the graph to show the heights and times for the particular day we are interested in.
Figure 8b shows how we do this, with the tidal curve published for Dartmouth.
We'll use the data for 18th June: LW (1.5m) at 0801; HW (3.9m) at 1435; LW (1.5) at 2030. 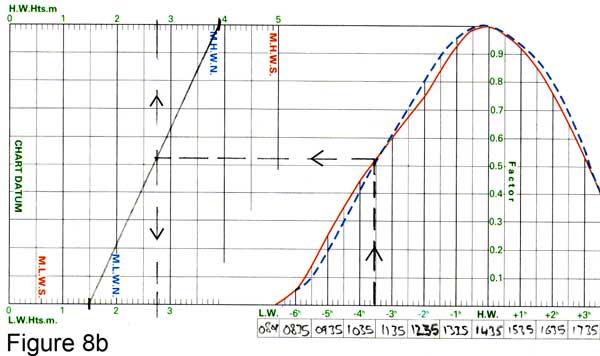
For the time scale, just write the time of high water (1435) in the middle time box, and then fill in the other boxes for each hour before and after high water.
We then need a way of getting the height scale. Mark the height of low water (1.5) on the bottom scale to the left, and the height of high water (3.9) at the top. Then draw a straight line between them, and that is our height scale for the day: any height between low water and high water can be read off the top or bottom.
So: to predict the height at 1100:
• find 1100 on the time scale
• go up a vertical line until you get to the curve
• go across until you get to the line which gives the height scale
• go up (or down) to read off the height between low water and high water heights - just over 2.7m.
Keeping It Real!
It's important to understand how to do these things, but please don't go overboard about it - don't waste time and effort on useless accuracy!
For one thing, tidal predictions are only approximations at the best of times, and in complex tidal areas they are even more approximate. Secondly, the weather affects the height of tide (e.g. high atmospheric pressure pushes the water level down, and a low pressure system will pull it up) and this can't be readily predicted. Then just think how uneven the sea bed is anyway, with old moorings and rocks strewn around. That, and the waves, make a mockery of predicting tidal heights to the nearest tenth of a meter or minute of time.
When you do this in practice, you will get a better feel for how precise you want to be. If, for example, you are working out when you will have enough water to get into a particular port, then give yourself a generous margin of time, and an extra meter under the keel - it takes the pressure off you!
Secondary Ports
Secondary ports are those places which don’t have tide tables in the almanac.
Nevertheless we want to make predictions of tidal heights near them, so we use a tide table for the recommended standard port and make some adjustments to the numbers.
Figure 9 shows some typical data for a secondary port.
The first line on TIDES is pretty crude information for predictions. It assumes you only have a tide table for Dover, and tells you that on average high water occurs “-0550 on Dover”, i.e. 5 hours fifty minutes before Dover; that the mean level (mid way between high and low) is 5.5m; duration is 0605, which means that low water occurs about 6 hours 5 minutes before the next high water (i.e. it's the time duration of the flood tide). "Zone" is time zone - 1 hour ahead of UT. 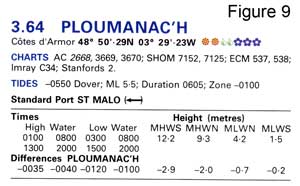 Ignore this first line - unless you've only got Dover tide tables.
The next line tells you which standard port to use, in this case St Malo (the arrow just shows where to look for St Malo's tide table in the book). The table below tells you the differences between the numbers given in the St Malo tide table and the corresponding numbers for this secondary port.
The differences are not constant. The time differences depend on the approximate times of high and low water at the standard port, and the height differences depend on whether we are on spring or neap tides.
So in figure 9, the difference for the high water time is between -0035 and -0040, i.e. Ploumanac'h high water is between 35 and 40 minutes before St Malo. When high water St Malo is at 0100 or 1300, the difference at Ploumanac'h is -0035 ; when high water St Malo is at 0800 or 2000 the difference at Ploumanac'h is -0040. When the HW time is somewhere in between (which it usually is) the difference is somewhere between -0035 and -0040.
Low water works in exactly the same way. The time difference is somewhere between -0120 and -0100: -0120 if low water time at St Malo is 0300 (or 1500) and -0100 if it is 0800 (or 2000).
The height differences also vary, this time according to whether the tides are springs or neaps or in between. At high water springs, the difference in height at Ploumanac'h is -2.9; for high water neaps the difference is -2.0; between springs and neaps, the difference is between these two numbers.
For convenience, the table gives you MHWS, MHWN, MLWN, MLWS at St Malo, and this helps you to see how close you are to springs or neaps when you look at the St Malo tide table for the day. And it also lets you work out MHWS, MHWN etc for Ploumanac'h: MHWS is 12.2 - 2.9 = 9.3m and so on.
For low water, the difference lies between -0.7 at neaps and -0.2 at springs.
So we need to work out the differences - then, starting with the day's tide table entry for St Malo, we apply those differences and so construct a tide table for Ploumanac'h.
Using Secondary Port Information
The most difficult thing about using this data is the interpolation: we need to interpolate between the times of high and low water at the standard port to get the time differences, and between spring and neap tides to get the height differences. But very often, it's not terribly important to be accurate.
In Ploumanac'h the time difference for high water is between -0035 and -0040, depending on the time of high water at St Malo. Big deal! When are we going to need that kind of accuracy? Estimating to the nearest five minutes is ample.
The issue is a little more significant for the time of low water: the difference we need to calculate is somewhere between 1 hour and 1 hour 20 minutes.
Still, we can approximate: say the St Malo LW on a particular day is 0423. We need to estimate where this lies between the times in the table, 0300 and 0800. 0423 is roughly a quarter of the way from 3 to 8 (you can estimate this with numbers, or just sketch a "scale" from 0300 to 0800 and mark 4 hours 23 minutes on it - or look at it on the face of your watch). So the difference we want is a quarter of the way from -0120 to -0100, and we therefore estimate -0115.
Similar approximations can be made for the height differences.
When you are somewhere between springs and neaps, just approximate the difference to apply: between -2.9 and -2.0 for high water - quite a simple job, given that there is only 0.9m between them (in practice estimating to the nearest half metre is often good enough, because you have to leave a safety margin anyway). The low water differences are even closer. 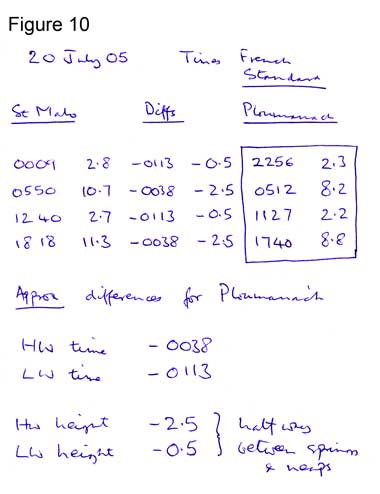
Once you have estimated the actual differences for the day, you can use the data to convert the standard port tide table to produce the equivalent information for the secondary port.
Figure 10 shows a worked example. The numbers under the heading St Malo are copied from the tide table: differences are worked out using the secondary port information in Figure 9, and are applied to St Malo's times and heights.
It is highly recommended that you write the workings down in this way, so that you (or someone else) can check them.
Given that you have the tide table information, you can borrow the tidal curve from another port to make tidal predictions between high and low water. Have a look at the curve for the standard port, or indeed for other ports that might be closer along the same stretch of coast and therefore more representative of the secondary port.
Using a suitable curve, put in the “tide table” data worked out for your secondary port and do exactly as described in the section above on using tidal curves.
Complex Tidal Areas
There are some areas of the coast where the tide does not follow simple patterns, and the almanac will generally provide as much guidance as it can.
One example is between Swanage and Selsey on the south coast of England. For these areas the almanac offers some alternative methods, together with a collection of irregular-looking tidal curves, generally worked off the time of low water rather than high.
The tide table for Poole gives time predictions for low water only, and the tidal curves for Poole Town Quay vary quite considerably according to the height of low water. Since the tidal ranges are pretty small it is doubtful whether it is worth spending very much time trying to make accurate predictions.
It is best to study the almanac itself for these somewhat exceptional methods for making tidal predictions. Once you know the basics, you should easily be able to understand the other methods.
2.3 Tidal Streams - Information and Prediction
What Are Tidal Streams?
Tidal streams are movement of the water caused by the flood and ebb of the tides.
Clearly, if high water is going to occur at some time in Dover, the water has to get there! It does this by flowing up the English channel and down from the North Sea.
So in the middle of the Channel or North Sea the water will move back and forth in time with the tides.
Inside an estuary or narrow bay it is pretty obvious that the water has to flow in when the tide is flooding (rising towards high water) and flow out again on the ebb.
Off the coast the timing is much more difficult to guess, because high water occurs at different times in different places along the coast. So at a particular time the water can be flowing in a westerly direction at one end of the channel, an easterly direction at the other end, and be stationary (slack) somewhere in the middle.
But - complex though it is, the pattern will repeat itself in time with everything else - in particular it will repeat itself in time with high tide at a particular place (like the tray of water that is being tipped back and forth in a regular rhythm).
So once we know the tidal stream patterns, we can predict them over a wide area, all related to the time of high water for one place.
Tidal Stream Atlases
A tidal stream atlas shows the flow of water in an area of sea. Because this changes over the 12 hour tidal cycle it shows 12 or 13 “snapshots” of what the water will be doing at hourly intervals. 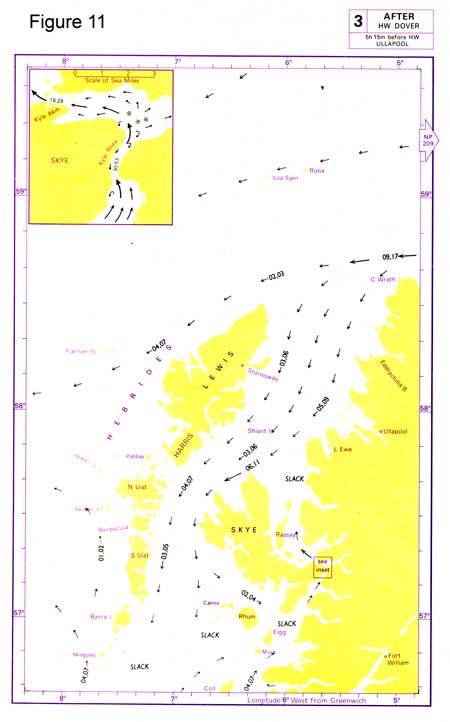
The hourly snapshots are usually given for one, two, three, four, five and six hours before and after the time of high water at a particular place. On a given day you can look up the time of high water at that place, and then write into the tidal stream atlas the actual time for each “snapshot”.
Figure 11 shows a typical page from a tidal stream atlas. It gives the place where the atlas is referred to (Dover), and arrows showing the flow of water at three hours after high water Dover. The numbers are the rates of flow in tenths of a knot, for neap and spring tides (you would expect the streams to be stronger when the tides are bigger).
Thus in a position just off the northern tip of Skye, where it says "06,11" the stream is in a south-westerly direction, 1.1 knots at springs and 0.6 knots at neaps.
You estimate the speed of the tidal streams when the tides are between springs and neaps (a table is provided in the back of the atlas if you want an accurate estimate).
Don’t worry that Dover is not even in the area concerned. The tidal streams can still be successfully related to high water times at Dover because the tide everywhere (Dover, the Hebrides) oscillates in time with the same tidal forces.
Tidal Stream Information on Charts
Sometimes the available tidal stream atlases don’t give very much large scale detail in the area you are interested in, so there is another very useful source of prediction information which is printed on charts.
A few charts include their own mini tidal atlases for the local area.
And most Admiralty charts include very detailed tidal stream predictions for particular positions where the streams have been observed.
The symbol for this position is a letter enclosed in a diamond, printed magenta, known as a tidal diamond. For each of these positions tidal data is given in a table on the chart.
Figure 12 shows an example, and the points to note are: 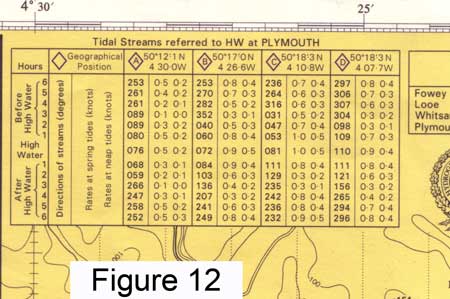
• the port to which the data is referred is clearly stated (in this case Plymouth)
• tidal stream data is tabulated for each hour, from six hours before to six hours after high water at that port
• the tidal stream data starts with the direction of flow (printed bold)
• it then states the rates of flow in knots, at spring tides and neap tides
• these are “snapshots” of what is happening on each hour (the actual speed and direction of flow changes smoothly and continuously between the tabulated "snapshots")
So if you are interested in the tidal stream at tidal diamond C (which is marked on the main chart at the position given in the table) four hours after high water at Plymouth (Devonport) on a spring tide: it will be flowing in direction 242 ° (True) at a rate of 0.8 knots.
Obviously you will need to estimate (interpolate) the rate if you are somewhere between spring tides and neaps. This can usually be done in your head accurately enough for our purposes.
Another tip: if you want to find out what time slack tide occurs, look at the change of direction on these tables. The “snapshots” of data won’t always show one that is exactly on slack i.e. a rate of zero, but the direction tells you what is really happening, i.e. when the flood turns to ebb and vice versa.
For example, in Figure 12 tidal diamond A shows slack with the tide turning from west-going to east-going between four and three hours before HW, and the next slack (east-going to west-going) somewhere between 2 and 3 hours after HW.
If the time of slack tide is particularly important to you e.g. for diving, remember that these are only predictions, and may not be spot-on accurate - they will depend on the weather anyway. So show up early, make sure the tide is flowing the way you expect it to be before slack, then wait for slack.
Thinking About What’s Happening
The general pattern of tidal streams will be a flood for approximately six hours, followed by an ebb for the next six hours.
The sources of tidal stream information will give the ability to accurately predict the flow in some places, but perhaps the more important thing is to study this information to get a general picture of what is happening at a particular time and over the full 12 hour tidal cycle.
You can imagine the way the water is flowing, and it is not surprising that it will be flowing faster round headlands, or be relatively slack in a protected bay.
Close in, the general direction of flow will be parallel to the coastline.
In an estuary it will flood into, and ebb out of, the river.
It’s important to visualise the flow of the tidal streams and do “common sense” checks of the tidal predictions, because it is all too easy to make an error in the prediction calculations if you are concentrating too hard on the numbers and not looking at the overall picture.